Grocery Store Shopping Experience
OVERVIEW
Our overarching goal for this project is concerned with how a technology-based product/service can help improve the top-level stressors to make the in-store grocery shopping experience more pleasant
ROLE & DURATION
UX Researcher | DePaul University
User Research, User Interviews, Surveys and Observational studies
Mar – June 2017
4 Team Members
The Problem
A 2015 consumer report identified twelve common reasons that people dislike grocery shopping. Some of them were too few checkout lanes, congested aisles, and too few product choices among others.
To solve this, technology-based services like Instacart, Peapod, etc address these stressors by helping people avoid the need to enter a physical grocery store and order everything with ease and convenience from the comfort of their homes.
However, anecdotally, many people still prefer to shop in-person, especially for produce.
Specific areas we are considering include:
- Navigating most effectively;
- Providing transparent sourcing and pricing information; and
- Keeping shoppers informed and up to date on product availability
We will be exploring how technologies might ameliorate some of the major in-store stressors and make the in-store grocery shopping experience more pleasant.
Observation Participants
All participants were recruited from our social networks and were over 18 years of age. It was a challenge identifying participants who were planning a grocery store visit in the next 3 – 4 days; we used the following criteria to identify eligible participants:

Table: Inclusion and Exclusion criteria to identify eligible participants
All participants were recruited from our social networks
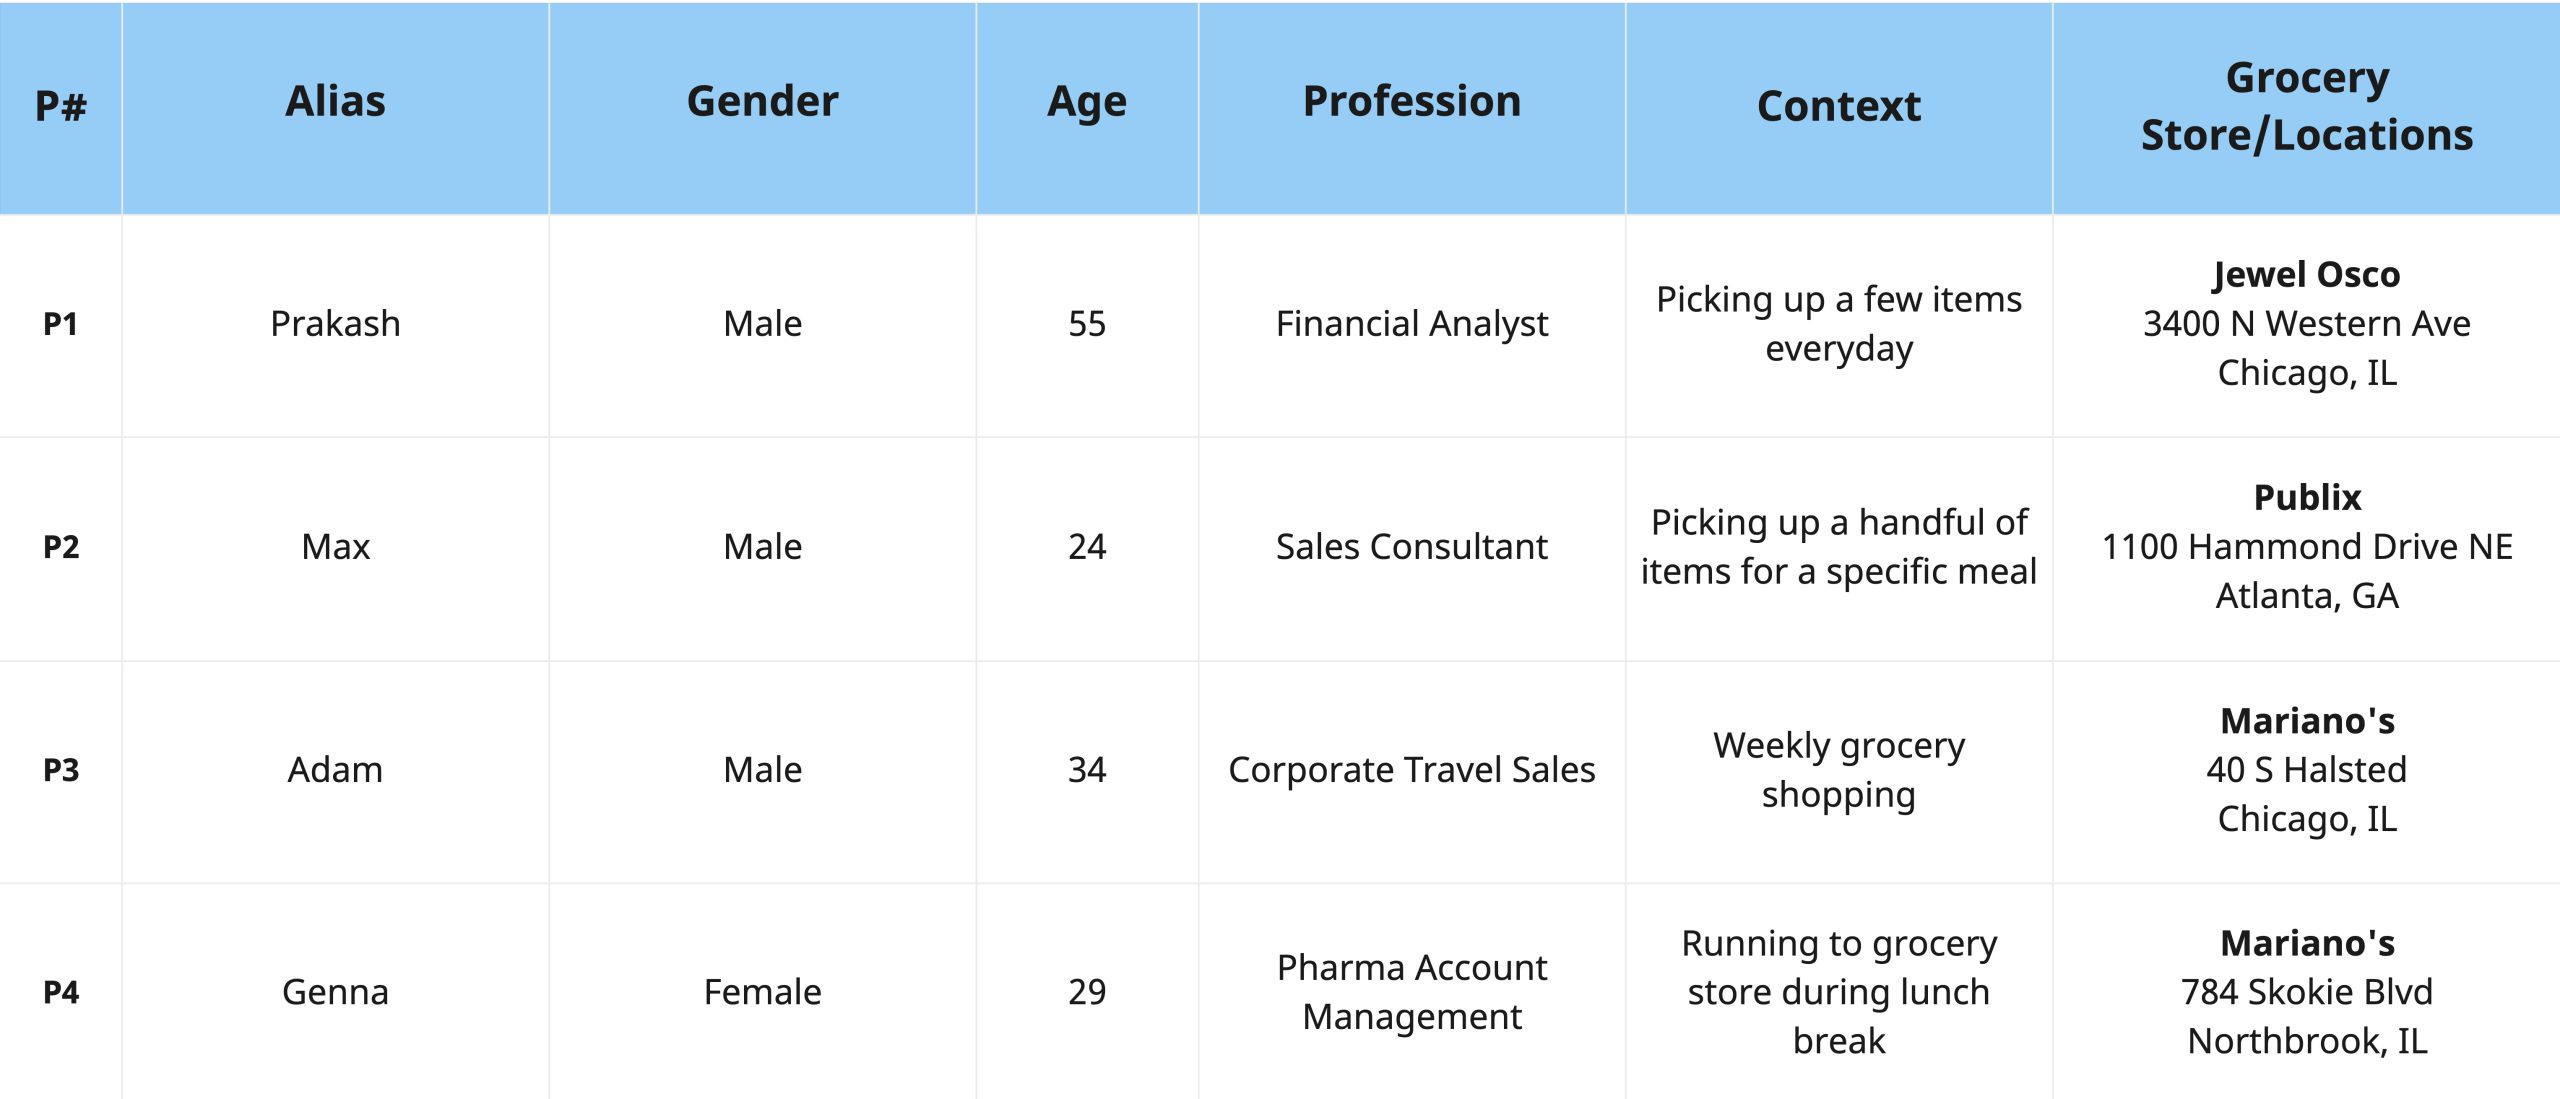
Table: Observation Participant Demographics
Observation Data Collection
All four observations took place in-person, at various grocery stores located in urban areas of Illinois and Georgia. Observation sessions ranged between 30 minutes and 65 minutes. Prior to the observations, participants were presented with an Informed Consent Form
While onsite, but before beginning the observations, we asked participants:
- How many times per month do you visit a grocery store?
- Which grocery store(s) do you typically shop at?
- Do you use online grocery shopping services such as Instacart, Amazon Fresh, Peapod, etc.?
- If ‘yes’, which services do you use?
The participants were then asked to begin shopping as they normally would. We followed our participants on their journey through the store, while staying a few steps behind to limit distraction and disruption of their shopping flow.
Observation Data Analysis
During observations, we took notes with a pen/notepad or directly on our smartphones. We used the AEIOU framework (Activities, Environment, Interactions, Observations, and Users) to facilitate review and comparison across the observations. Each team member individually transcribed their content to the centralized AEIOU Observation Results document
Next, we added information from our observations to Storm board (an online affinity diagramming tool). After all team members completed their postings and reviewed the AEIOU results, we examined and organized the data across observations.
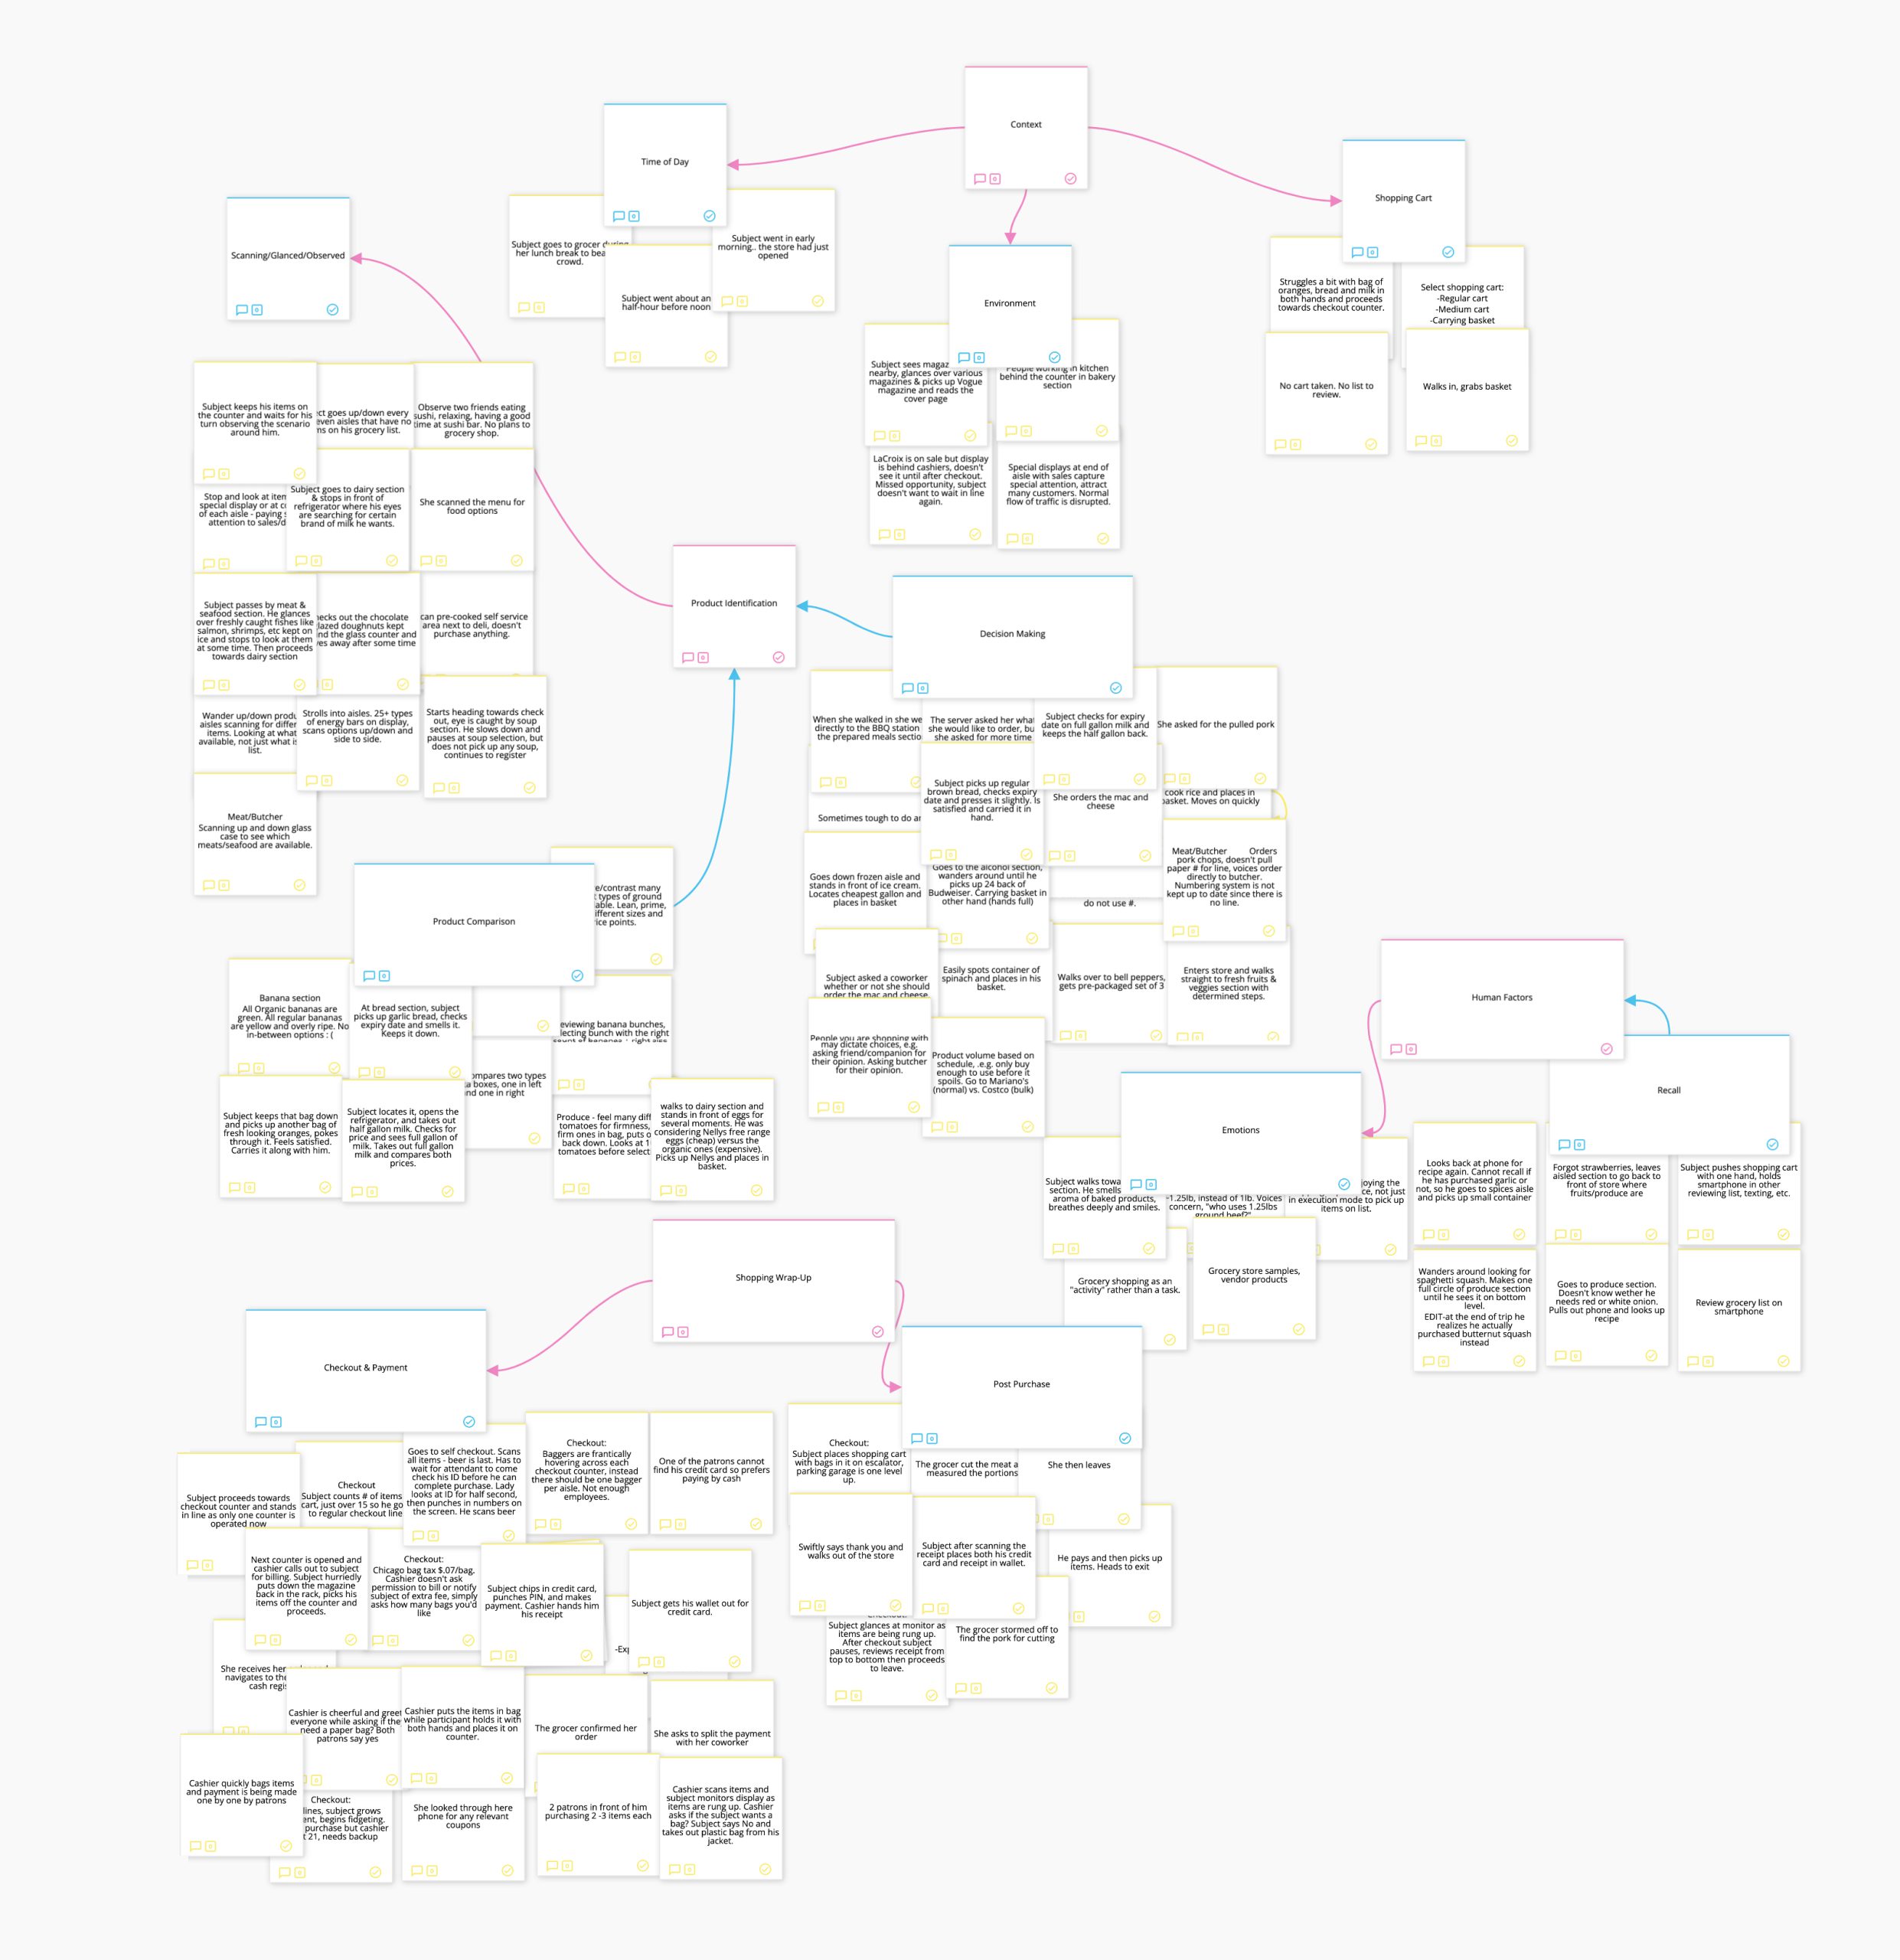
Image: The observations were gathered into individual insights and combined into common themes to create affinity diagram using Stormboard
After two sessions of brainstorming and organizing our notes we agreed on common themes that were used to formulate the findings presented in the Findings section.
The sequence model illustrates a typical shopping path and the decision points our participants encountered as they navigated through their respective grocery stores. We aimed to visualize the flow as it coincides with general grocery store layouts, while highlighting the continuous reference to the grocery list, articulating how it serves as a central spoke of the overall experience.
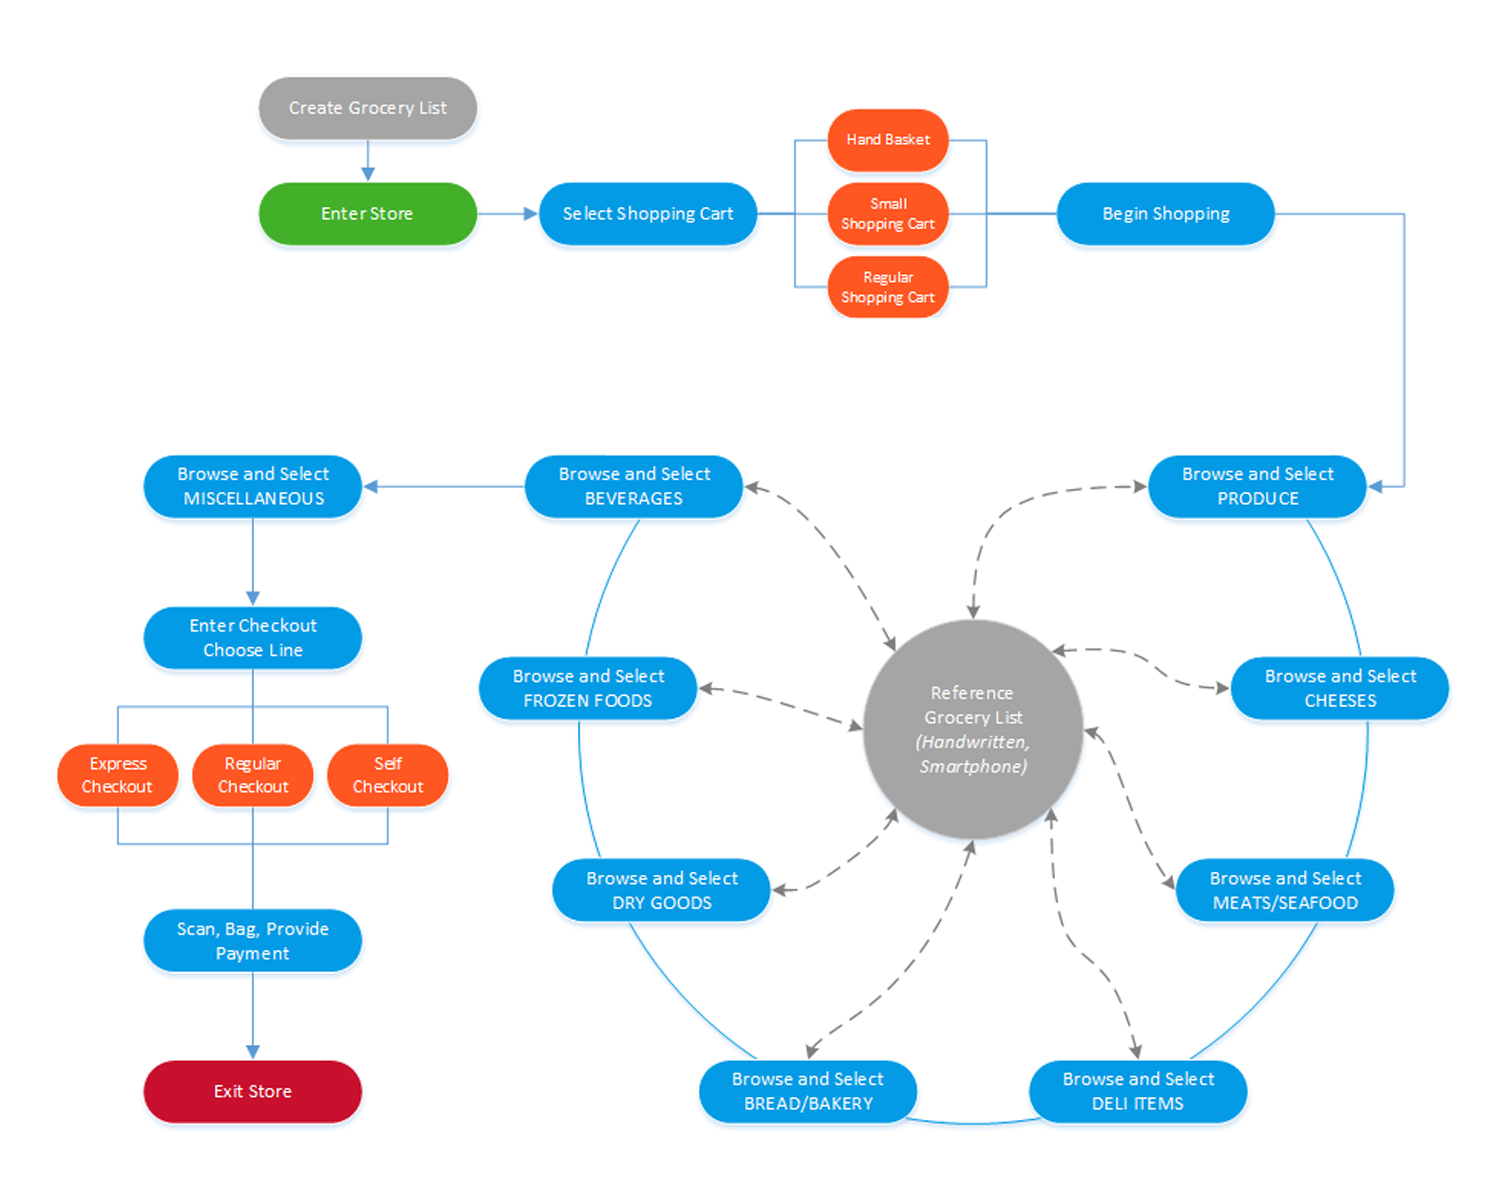
Fig: Sequence model shows the typical shopping path and decision points made by participants during observation
Interview Participants
We conducted four interviews to better understand habits, motivations, preferences, and nuances of the in-store grocery shopping experience.
Participants were recruited through friends, neighbors and family based on their answers to screener questions:
- Are you at least 18 years of age?
- Do you shop in-person at a grocery store at least once a month?
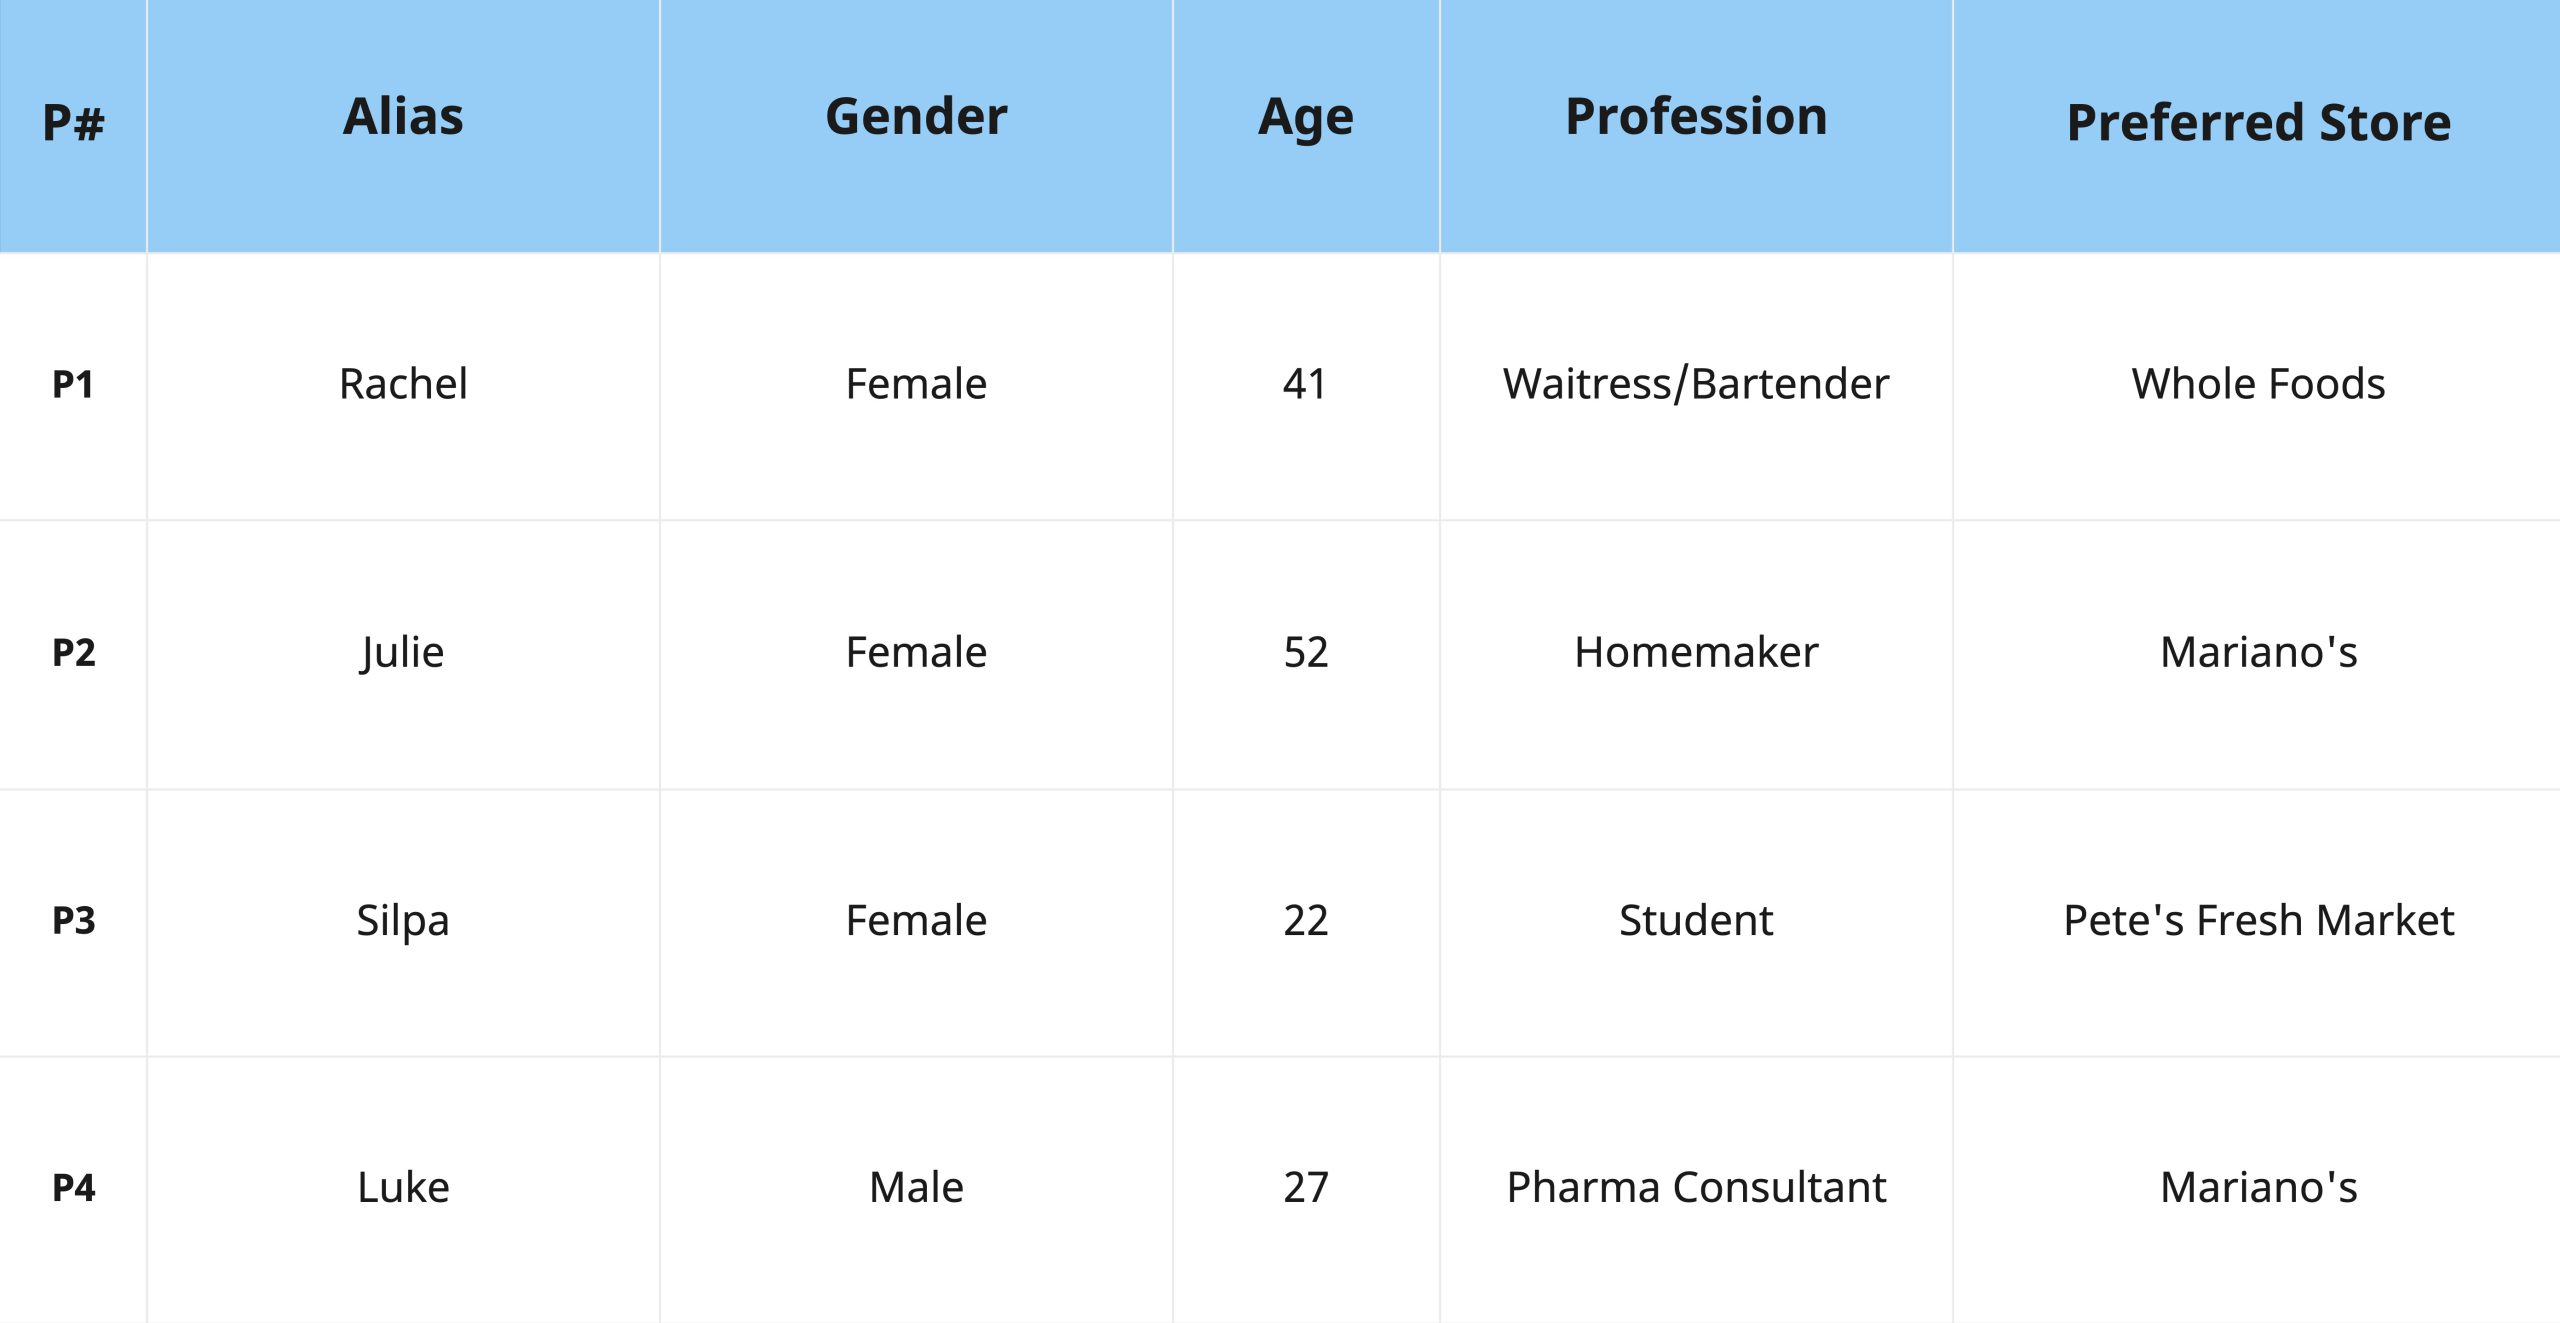
Table: Interview Participant Demographics
Interview Data Collection
We conducted our interviews utilizing the Interview Protocol. Each interview lasted approximately 20 – 35 minutes. All four interviews took place in the Chicagoland area and all participants signed an informed consent form and agreed to be audio recorded prior. In addition to the audio recording, two researchers took notes, and a third used Cyclops.io to auto-transcribe the interview in real time.
Each interview began with a series of warm up questions to help build rapport between the researcher and interviewee.
We asked about their:
- grocery store shopping habits;
- last visit to the grocery store;
- opinions about shopping and the stores they often visited; and
- reasons for shopping somewhere other than their preferred store
The answers provided the researcher with a baseline for conducting the remainder of the interview, and allowed the interviewee to begin thinking holistically about their grocery shopping experiences. All questions were open ended, and asked in a manner that would elicit direct, unbiased feedback.
Interview Data Analysis
We transcribed the audio recordings and then inductively coded noting attributes, emotions, habits, annoyances, and key quotes. All codes were uploaded to Storm board to identify common themes and the findings presented in the Findings section.
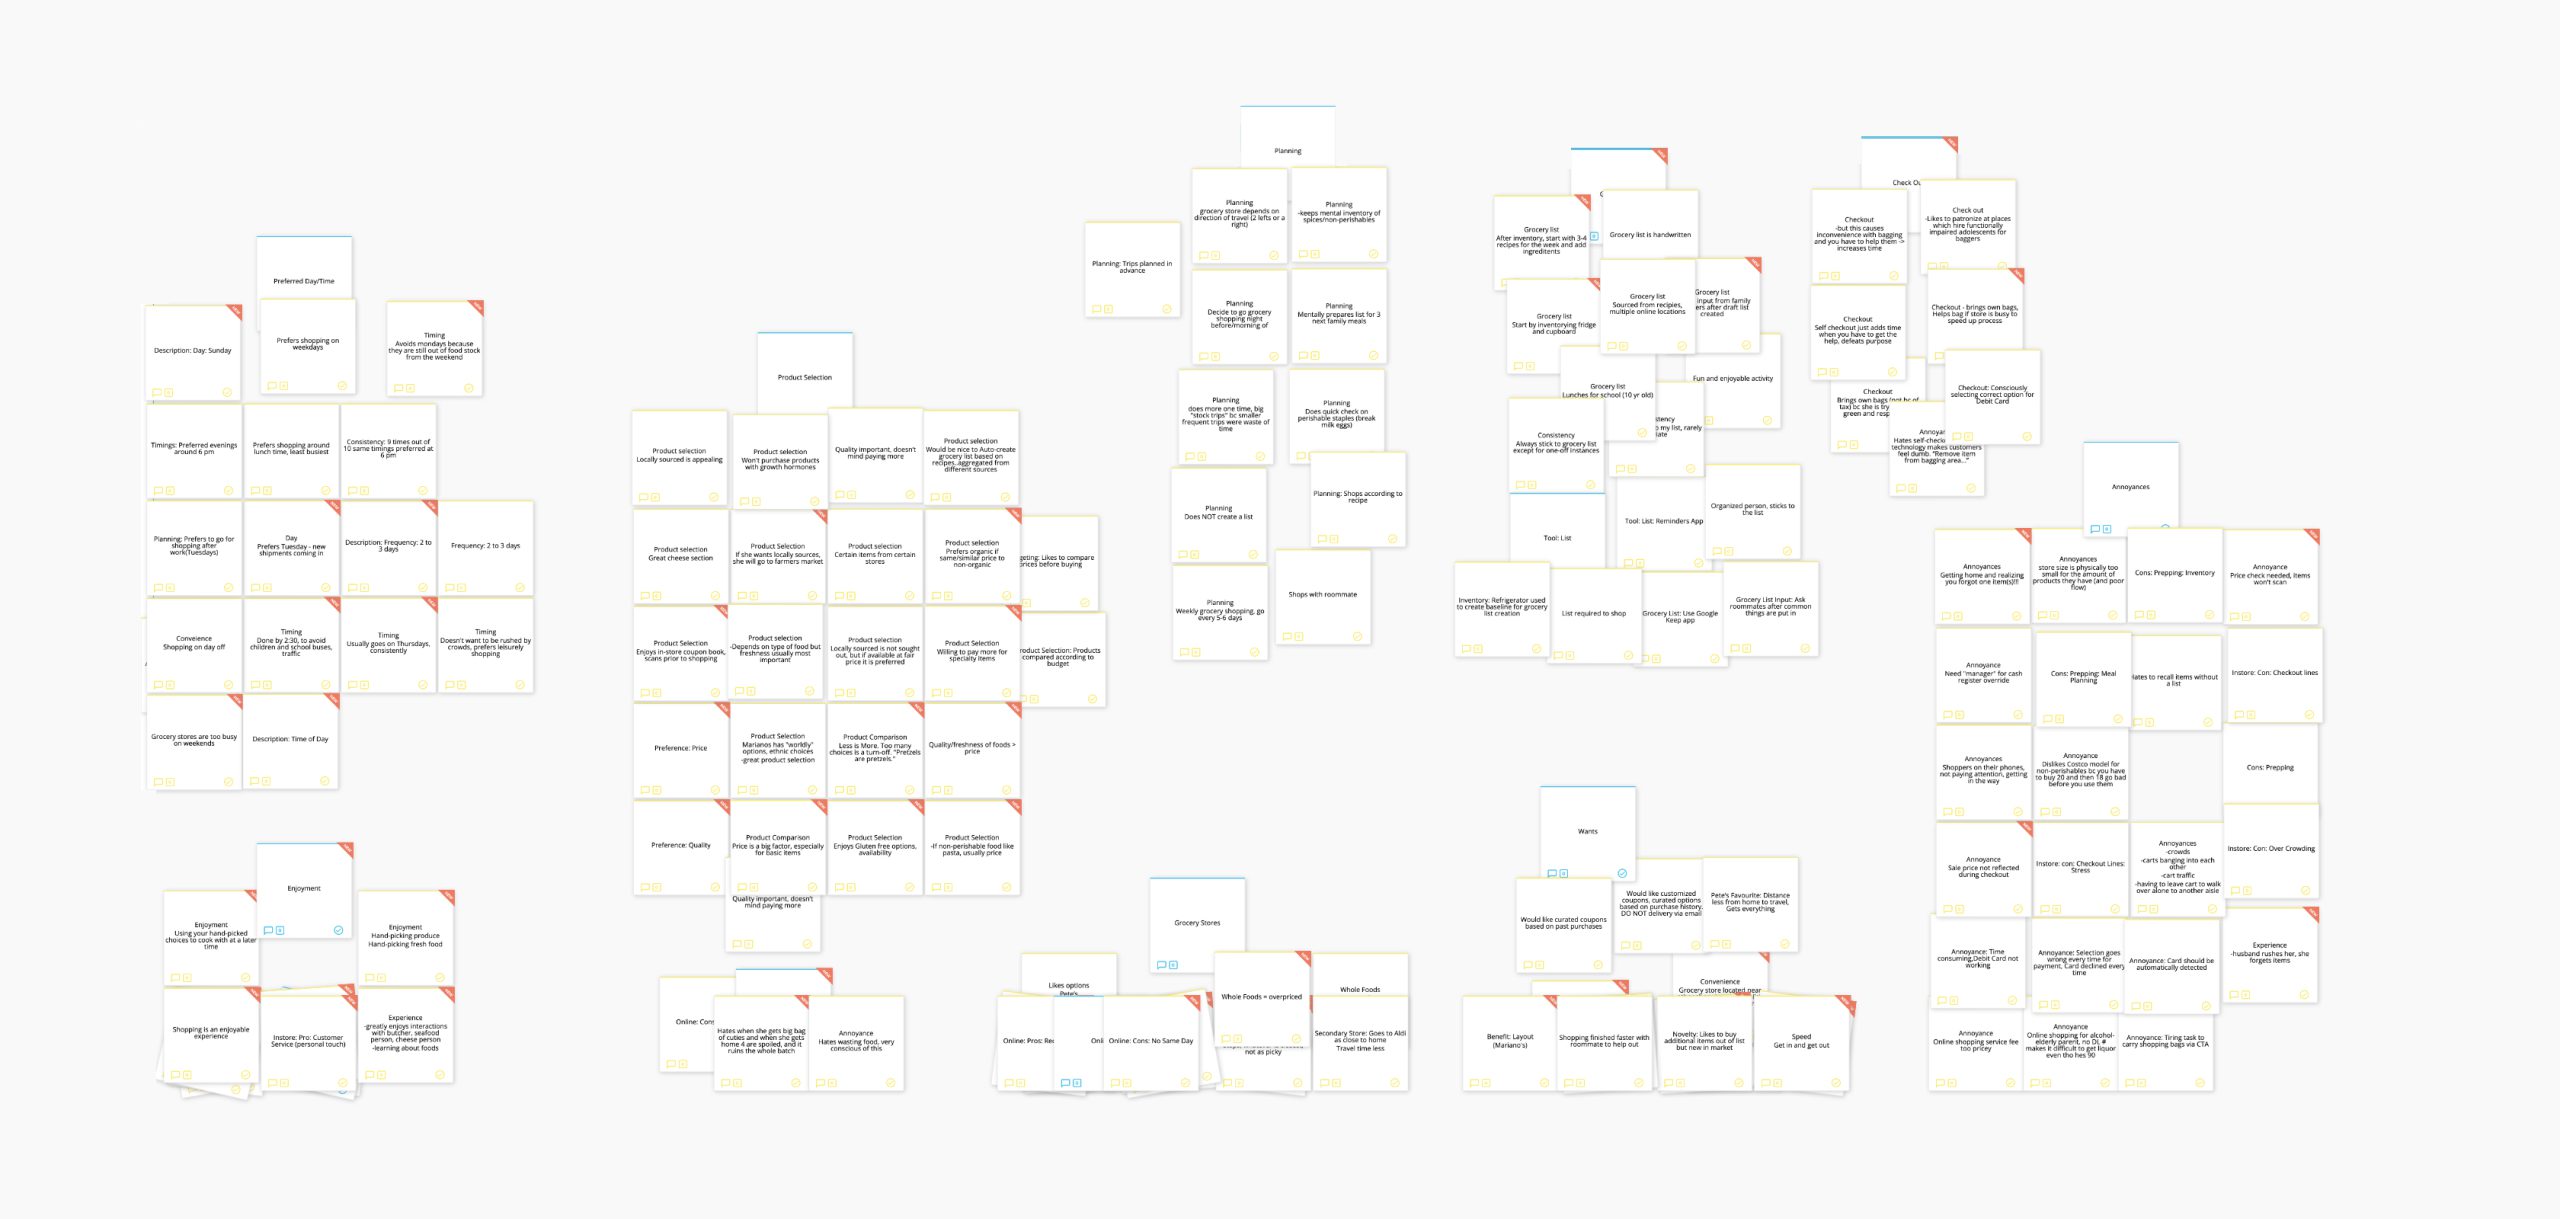
Image: The observations were gathered into individual insights and combined into common themes to create affinity diagram using Stormboard
Survey Participants
To further understand the trends and themes uncovered during observations and interviews, we conducted a survey as the final phase of our research study. The survey covered an expansive set of topics related to the end to end grocery shopping experience.
Our survey participants consisted of DePaul HCI students and alumni, friends, family, and co-workers. Participants were recruited through our own personal networks, via email, social media accounts and text message. Additionally, a link to our survey was posted on the DePaul HCI [UI/UX] Facebook page. This Facebook page is restricted to current DePaul HCI students and alumni of the HCI program.
To participate in the survey, participants needed to meet two requirements:
- You must be at least 18 years old
- You must visit a grocery store at least once a month
Participants were presented with a consent form prior to taking the survey. In total, we collected responses from 75 participants.
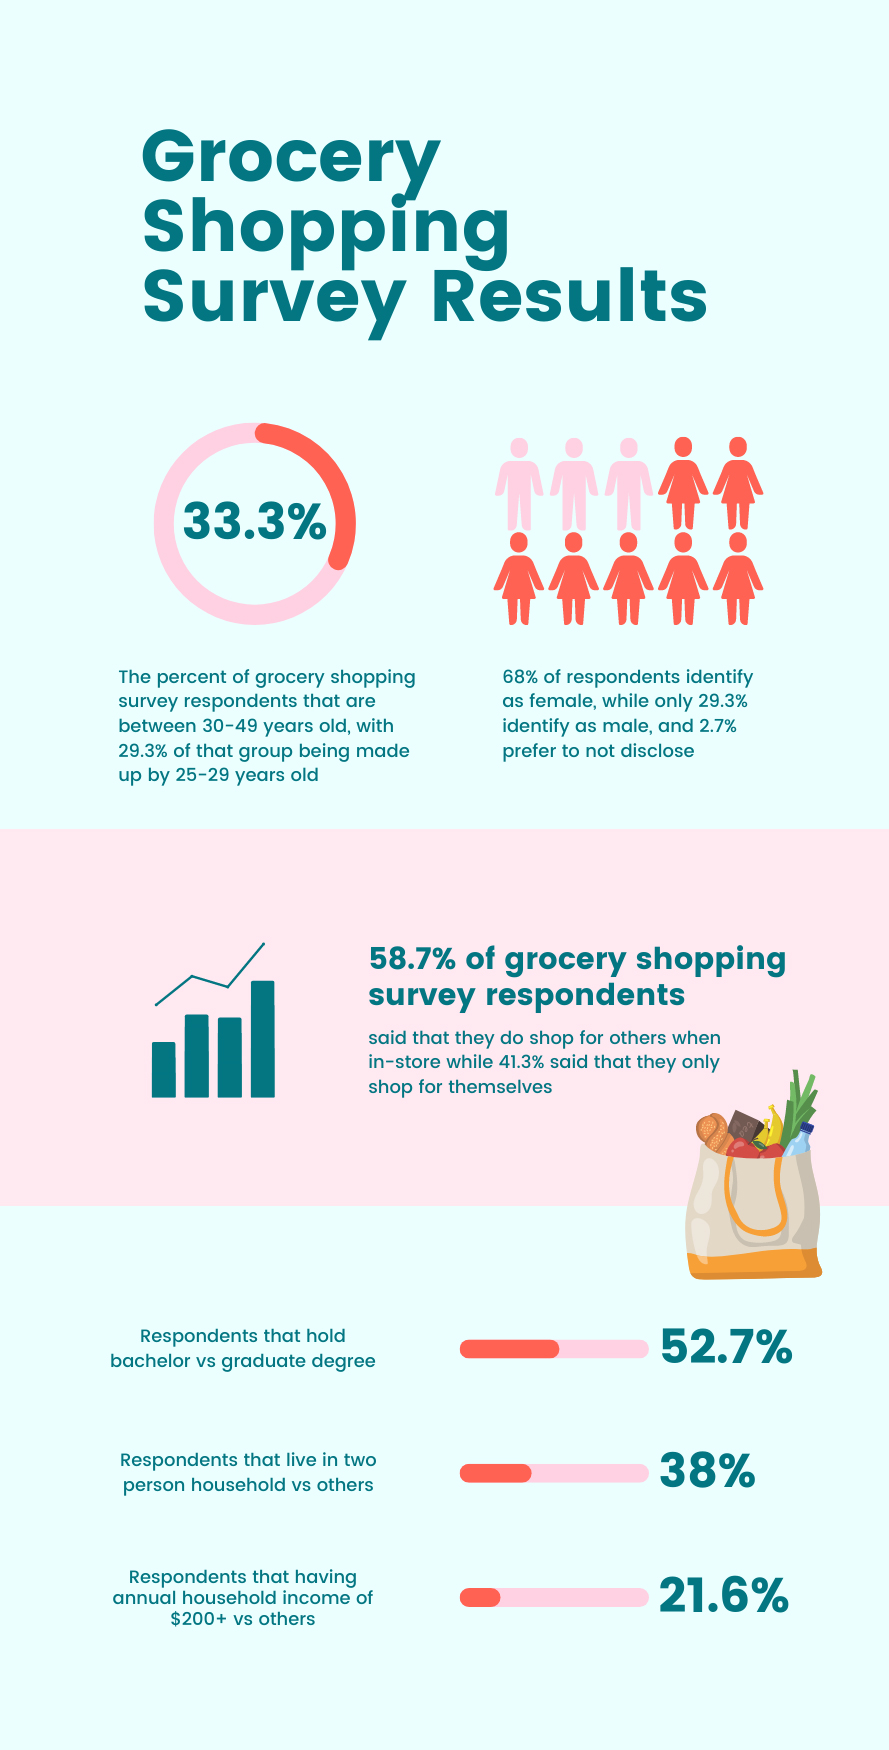
Fig: Survey results collected from demographic information to understand how backgrounds influence shopping habits and experiences
Findings
In the next sections, we describe our observation and interview findings.
Observation Findings
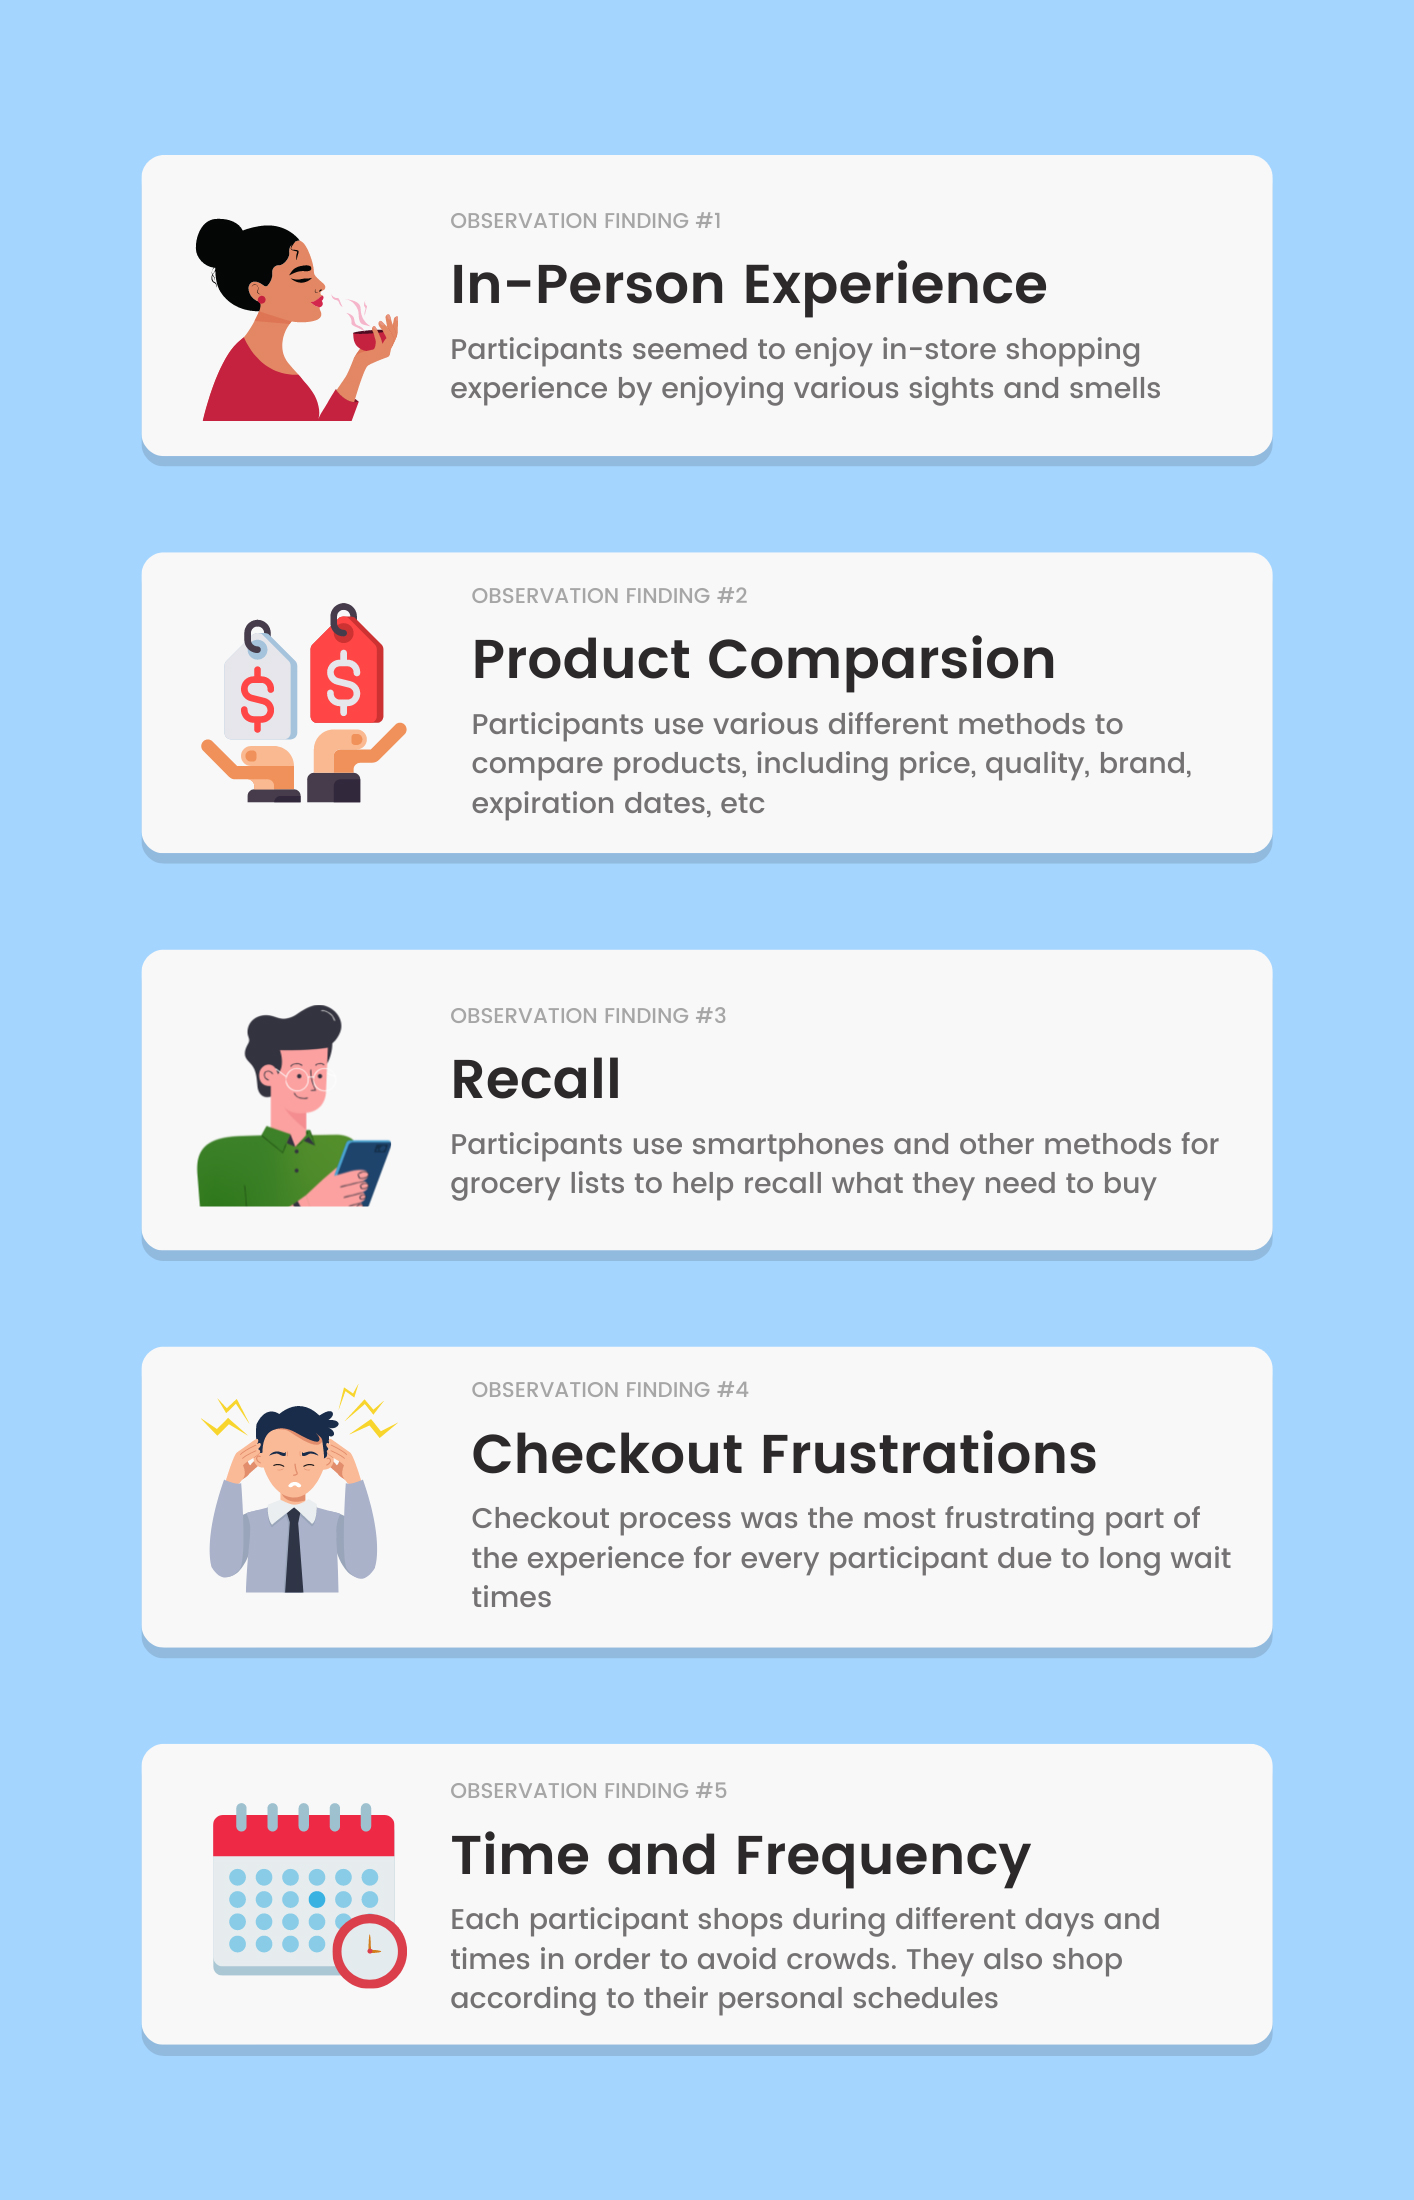
- In-person experience: Three of the four participants took advantage of the in-person shopping experience by indulging in activities that could otherwise not be completed in a digital environment.
- Product comparison: All participants compared products to assess value, freshness of produce and expiration dates.
- Recall: All four participants used their smartphone at some point during their shopping experience to recall information.
- Checkout frustrations: The checkout process presented the most frustration. All four participants were asked for different combinations of input from the cashier and checkout keypad before completing their purchase.
- Timing & frequency: Participants had a wide range of habits associated with grocery store shopping; i.e. when and how often they shopped. Their motivations for timing and frequency were varied.
Interview Findings
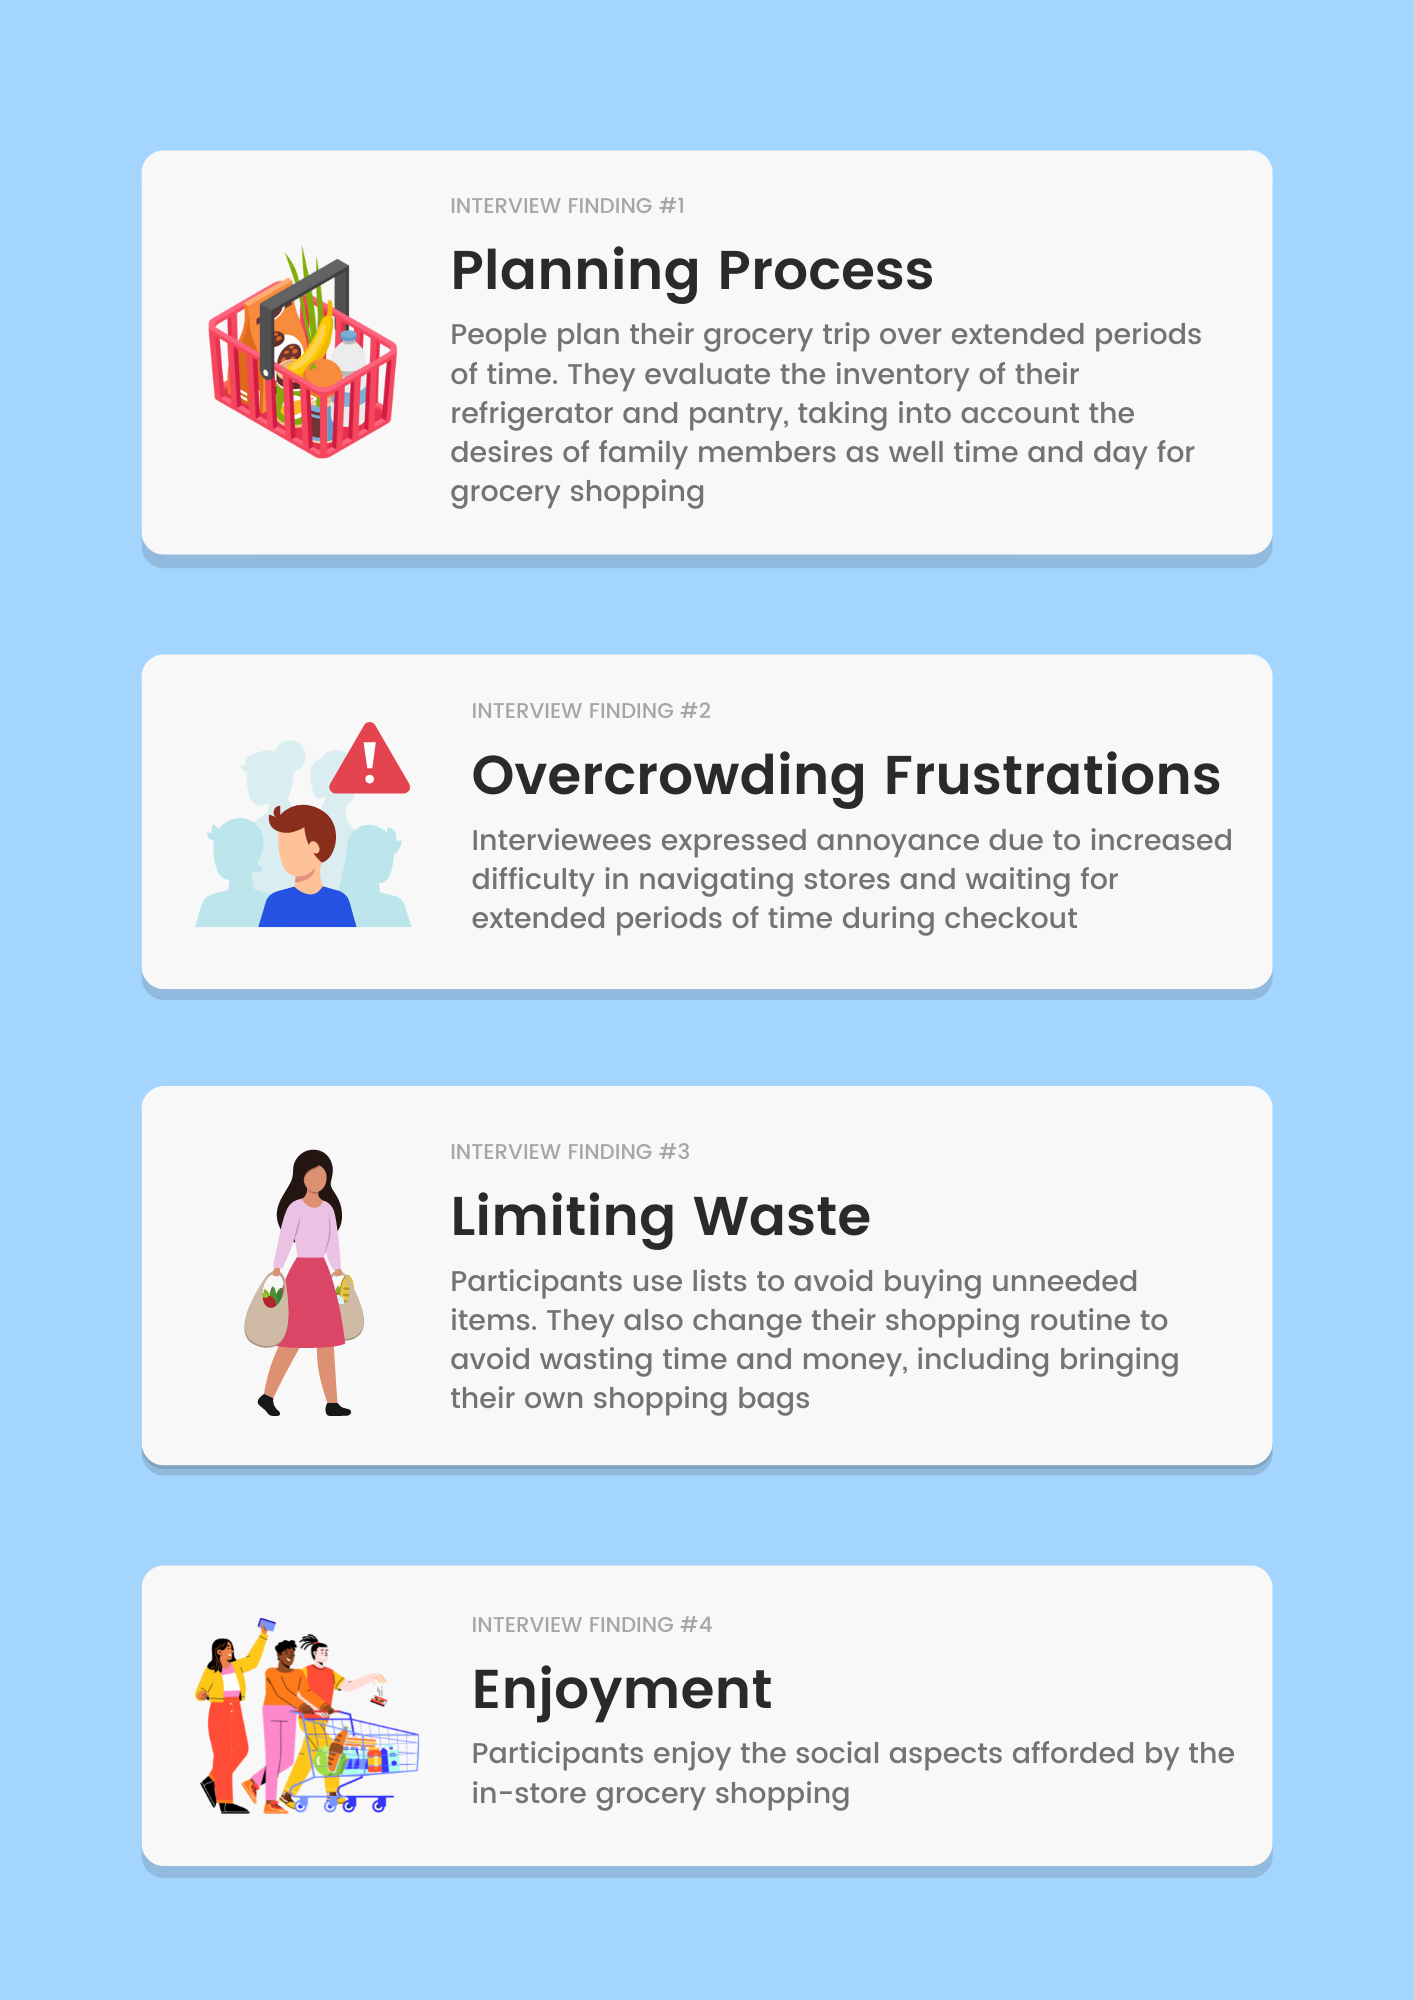
- Planning Process: We found that participants do not simply jot down a grocery list in a defined period of time. Instead, the planning process is multifaceted and happens over extended and non-continuous periods.
- Overcrowding Frustrations: All four participants expressed annoyance about crowded grocery stores for two reasons viz increased difficulty in navigating the store and increased wait times at checkout.
- Limiting Waste: Our participants expressed concerns about the volume of waste produced by shopping, which impacted their shopping habits in varied ways.
- Enjoyment: As in our observations, we found that our participants enjoyed the shopping experience, despite their expressed frustrations. Reasons for enjoyment included social interaction and inspiration for cooking.
Survey Findings
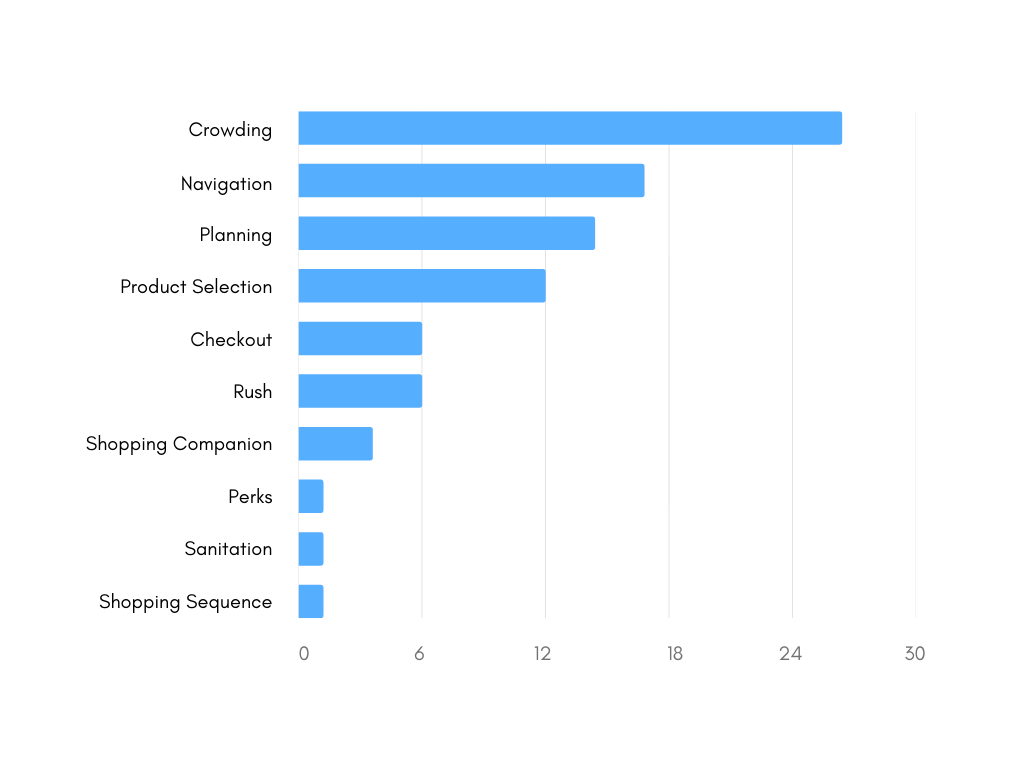
In the survey, we asked participants to think about their last visit to the grocery store and to describe what aspects made the shopper annoyed, anxious, relaxed or pleased by their experience. The results were able to verify our previous findings that shoppers are concerned with
- overcrowding in the grocery store,
- navigating the store layout,
- the upfront planning involved with grocery shopping, and
- the store’s product selection
Feature Matrix

Table: Feature Matrix table showing priority, impact and feasibility for each feature
Conclusion
The goal of this project is to evaluate the in-store grocery shopping experience (in the US) to determine ways technology can be utilized to improve it. Our observations demonstrated that grocery shopping is a complex process that we feel can be greatly improved.
Discussion
Our observations revealed the importance of a human side of the shopping experience; participants had good feelings about shopping. While the intent is to enhance the grocery shopping experience with technology, a critical design decision for solving this problem is to refrain from letting the technology take away from the joy and relaxation people reported.
As the Sequence Method illustrates, we found that shoppers often used their smartphones throughout the shopping experience. We feel that a solution will require less focus on smartphones to help people engage more with the physical surroundings in the stores and leave them free for more social interaction.
2. List Sharing feature
In regard to planning, we found that our participants were rarely shopping only for themselves – rather, they often asked for input of family or roommates to create their shopping list. This finding suggests that an application with a feature to share lists with others would be appreciated by our users.
3. Real time metrics
A common frustration among all participants was frustrations of store crowding. This finding suggests that our solution should include some live, real time metrics on how many people are in the store at any given time, or a heat map of which section is least busy, so that shoppers can avoid the hectic crowds.
4. Waste tracker
Another finding was that the participants were conscious about reducing waste- of food, time, money and materials. This indicates that our solution should include a tracker of how much of each of these resources is spent in each section, or for each whole trip. The users would benefit from an application could suggest various ways to eliminate each of these types of waste.
5. New Product Suggestions
Finally, we found that users take pleasure in the human interactions at the grocery store, including talking to grocery staff. They also enjoy the cooking inspiration which comes from browsing the selection of products. This implies that users would appreciate a feature which suggests new products and offerings, or provides a schedule for when new products become available. Additionally, users may enjoy a list of recipes which incorporate these products.
For next steps, we recommend expanding research into items listed within features matrix. More refined interviews and/or surveys can be constructed around features with both a high priority and high impact. Additionally, rapid prototyping can be facilitated to gain preliminary insights into the validity of the priority matrix. The results of this additional research will provide guidance on whether research should continue.
Limitations and Future Work
There were several limitations with our observational study as follows:
- Various scenarios not taken in consideration
Two participants were picking up a short list of items, one was doing his weekly shopping, and another was purchasing lunch. Additionally, there are a considerably more scenarios for which people go grocery shopping which we did not observe. Examples include shoppers who go to the grocery store multiple times per week, shoppers who supplement their grocery store purchases with online alternatives, those shopping for multiple people, and those shopping with children in-store - Only Urban areas covered
We did not conduct any observations in rural areas that might affect they have on grocery store layouts, crowds, shopper mindsets or other variables. - Small sample size
A limitation of both our interviews and observation was our small sample size that may not generalize to a larger (even urban) population. A limitation of the surveys dealt with demographics and testing of our hypothesis. The majority of survey respondents are from Chicago and the surrounding Chicagoland area. To account for differences in experience, pricing and product selection it’s important to capture a broader sample of users from other geographic regions.
Let's Connect
 raskarparnika1@gmail.com
